3@brief `main()` shows how to
4 [minimize()](https://docs.scipy.org/doc/scipy/reference/generated/scipy.optimize.minimize.html)
5 the [objective function()](#calibration.objective_function) for antenna phase center
12from pathlib
import Path
13from initialise
import load_pueoEvent_Dataset
21def generate_antenna_phase_center_pairs_with_placeholders(qrh_dot_dat: Path) -> pl.DataFrame:
22 r"""!Creates [antenna pairs](#antenna_pairs.generate_MI_antenna_pairs) with placeholder
23 integers as antenna phase centers.
25@param[in] qrh_dot_dat Path to `qrh.dat`
26@retval nominal_phase_center_pairs
32$ A1_Rho (placeholder) <u16>
33$ A1_Phi (placeholder) <u16>
34$ A1_Z (placeholder) <u16>
40$ A2_Rho (placeholder) <u16>
41$ A2_Phi (placeholder) <u16>
42$ A2_Z (placeholder) <u16>
48 -# Calls #antenna_attributes.read_MI_antenna_geometry() to read `qrh.dat` to obtain
49 antenna face center positions
50 -# Calls #antenna_attributes.get_MI_nominal_phase_center() to convert face centers to
52 -# Adds three columns to store placeholder values of the phase centers; these integer placeholders
53 serve as dictionary keys.
56┌────────┬────────┬──────┬────────────────┬────────────────┬───────────────┬──────────┬───────────┬───────┐
57│ AntNum ┆ AntIdx ┆ Ring ┆ Rho ┆ Phi ┆ Z ┆ Rho ┆ Phi ┆ Z │
58│ --- ┆ --- ┆ --- ┆ (placeholder) ┆ (placeholder) ┆ (placeholder) ┆ --- ┆ --- ┆ --- │
59│ enum ┆ u32 ┆ u8 ┆ --- ┆ --- ┆ --- ┆ f64 ┆ f64 ┆ f64 │
60│ ┆ ┆ ┆ u16 ┆ u16 ┆ u16 ┆ ┆ ┆ │
61╞════════╪════════╪══════╪════════════════╪════════════════╪═══════════════╪══════════╪═══════════╪═══════╡
62│ 101 ┆ 0 ┆ 1 ┆ 0 ┆ 96 ┆ 192 ┆ 1.188 ┆ 0.0 ┆ 5.114 │
63│ 201 ┆ 1 ┆ 2 ┆ 1 ┆ 97 ┆ 193 ┆ 2.296 ┆ 0.0 ┆ 1.457 │
64│ 301 ┆ 2 ┆ 3 ┆ 2 ┆ 98 ┆ 194 ┆ 2.296 ┆ 0.0 ┆ 0.728 │
65│ 401 ┆ 3 ┆ 4 ┆ 3 ┆ 99 ┆ 195 ┆ 2.296 ┆ 0.0 ┆ 0.0 │
66│ 102 ┆ 4 ┆ 1 ┆ 4 ┆ 100 ┆ 196 ┆ 1.076821 ┆ 0.261538 ┆ 4.476 │
67│ … ┆ … ┆ … ┆ … ┆ … ┆ … ┆ … ┆ … ┆ … │
68│ 423 ┆ 91 ┆ 4 ┆ 91 ┆ 187 ┆ 283 ┆ 2.295825 ┆ -0.523638 ┆ 0.0 │
69│ 124 ┆ 92 ┆ 1 ┆ 92 ┆ 188 ┆ 284 ┆ 1.07708 ┆ -0.26224 ┆ 4.476 │
70│ 224 ┆ 93 ┆ 2 ┆ 93 ┆ 189 ┆ 285 ┆ 2.295502 ┆ -0.261893 ┆ 1.457 │
71│ 324 ┆ 94 ┆ 3 ┆ 94 ┆ 190 ┆ 286 ┆ 2.295502 ┆ -0.261893 ┆ 0.728 │
72│ 424 ┆ 95 ┆ 4 ┆ 95 ┆ 191 ┆ 287 ┆ 2.295502 ┆ -0.261893 ┆ 0.0 │
73└────────┴────────┴──────┴────────────────┴────────────────┴───────────────┴──────────┴───────────┴───────┘
75 -# Calls #antenna_pairs.generate_MI_antenna_pairs with the above dataframe as the input.
77 from antenna_pairs
import generate_MI_antenna_pairs
78 from antenna_attributes
import read_MI_antenna_geometry, get_MI_nominal_phase_center
80 fc: pl.DataFrame = read_MI_antenna_geometry(qrh_dot_dat=qrh_dot_dat)
82 nominal_and_placeholders: pl.DataFrame = (
83 get_MI_nominal_phase_center(face_centers=fc, coordinates=
"cylindrical")
85 pl.arange(pl.len()).alias(
"Rho (placeholder)").cast(pl.UInt16),
86 pl.arange(pl.len(), pl.len() * 2).alias(
"Phi (placeholder)").cast(pl.UInt16),
87 pl.arange(pl.len() * 2, pl.len() * 3).alias(
"Z (placeholder)").cast(pl.UInt16)
90 "AntNum",
"AntIdx",
"Ring",
"Rho (placeholder)",
"Phi (placeholder)",
"Z (placeholder)",
91 pl.col(
"Rho[m]").alias(
"Rho"), pl.col(
"Phi[rad]").alias(
"Phi"), pl.col(
"Z[m]").alias(
"Z")
95 nominal_phase_center_pairs: pl.DataFrame = (
96 generate_MI_antenna_pairs(antennas=nominal_and_placeholders)
97 .select(pl.all().exclude(
r"^A[12]_AntIdx$"))
100 return nominal_phase_center_pairs
103def __get_all_run_numbers(pueo_mc_data: Path) -> [int]:
104 """! A temporary helper function of #load_dataset_and_measure_time_delays()
106 @param[in] pueo_mc_data See the parameter of #initialise.load_pueoEvent_Dataset
108 * This function retrieves the run numbers (negative sign allowed) of the `run/` subdirectories
111 * The runs are returned as a list of integers.
113 * The function is here only for testing purposes,
114 as it makes little sense to use every single run for antenna calibration.
118 run_number_pattern_ = re.compile(
r'^run([+\-]?\d+)$')
120 return [int(run_number_pattern_.match(run_directories_.name).group(1))
121 for run_directories_
in pueo_mc_data.rglob(
"run*")]
124def load_dataset_and_measure_time_delays(dataset: ROOT.pueo.Dataset,
125 phase_center_pairs: pl.DataFrame) -> pl.DataFrame:
126 r"""! Uses [SciPy's correlate()](https://docs.scipy.org/doc//scipy-1.16.2/reference/generated/scipy.signal.correlate.html)
127 to "measure" the delays of [waveforms](#waveform_plots.load_waveforms) between antenna pairs
129 @param[in] dataset The output of #initialise.load_pueoEvent_Dataset
130 @param[in] phase_center_pairs The output of #generate_antenna_phase_center_pairs_with_placeholders
131 @retval pulser_directions_and_measured_time_delays
133 * The input `dataset` should have been initialized with a (valid) run number,
134 but that is not the only run that gets loaded.
135 For now, [all runs](#__get_all_run_numbers) are used.
138$ measured time delays (ns) <f64>
139$ max correlation <f64>
142$ A1_Rho (placeholder) <u16>
143$ A1_Phi (placeholder) <u16>
144$ A1_Z (placeholder) <u16>
150$ A2_Rho (placeholder) <u16>
151$ A2_Phi (placeholder) <u16>
152$ A2_Z (placeholder) <u16>
156$ incoming pulse direction (Phi Theta) <array[f64, 2]>
158 * The `dataset` is also used to load the directions of the incoming pulses
159 (\f$^\circ\phi\f$ and \f$^\circ\theta\f$ in payload coordinates).
160 * `measured time delays (ns)` is computed by the helper function
161 #_scipy_cross_correlate_all_pairs_for_one_event().
165 from locate_signal
import _get_true_direction
166 from waveform_plots
import load_waveforms, upsample_waveforms
169 pulser_directions_and_measured_time_delays = pl.DataFrame()
172 all_runs: [int] = __get_all_run_numbers(
174 dataset.getDataDir(ROOT.pueo.Dataset.PUEO_MC_DATA)
178 dataset.loadRun(run, ROOT.pueo.Dataset.PUEO_MC_DATA)
179 for i
in range(dataset.N()):
183 load_waveforms(dataset=dataset)
185 .select(
"AntNum",
"Pol",
"waveforms (volts)",
"step size (nanoseconds)")
187 up: pl.DataFrame = upsample_waveforms(waveforms=wf, upsample_factor=5)
189 pulser_directions_and_measured_time_delays.vstack(
190 _scipy_cross_correlate_all_pairs_for_one_event(
191 phase_center_pairs=phase_center_pairs,
194 (pl.lit(_get_true_direction(dataset=dataset)) * np.pi / 180)
195 .cast(pl.Array(pl.Float64, 2))
196 .alias(
"incoming pulse direction (Phi Theta)")
200 return pulser_directions_and_measured_time_delays
203def _scipy_cross_correlate_all_pairs_for_one_event(phase_center_pairs: pl.DataFrame,
204 waveforms: pl.DataFrame) -> pl.DataFrame:
205 r"""! A helper function of #load_dataset_and_measure_time_delays()
207 @param[in] phase_center_pairs The output of #generate_antenna_phase_center_pairs_with_placeholders
208 @param[in] waveforms The output of #waveform_plots.load_waveforms
209 @retval measured_time_delays
213$ measured time delays (ns) <f64>
214$ max correlation <f64>
217$ A1_Rho (placeholder) <u16>
218$ A1_Phi (placeholder) <u16>
219$ A1_Z (placeholder) <u16>
225$ A2_Rho (placeholder) <u16>
226$ A2_Phi (placeholder) <u16>
227$ A2_Z (placeholder) <u16>
233 -# [Load the waveforms](#waveform_plots.load_waveforms) of both antennas in the antenna pair
234 -# Cross correlate the waveform pair
235 -# Figure out by how much one needs to shift the second waveform against the first
236 in order to achieve the maximum correlation.
237 -# The above is called `measured time delays (ns)` in the output dataframe.
238 -# For more details, see [Explanation](#scipy_corr_expl).
240 from scipy.signal
import correlate, correlation_lags
244 signal_length = len(waveforms[
"waveforms (volts)"][0])
245 CORRLAGS: np.ndarray = correlation_lags(signal_length, signal_length)
247 STEP_SIZE = waveforms[
"step size (nanoseconds)"][0]
249 assert np.mean(waveforms[
"step size (nanoseconds)"].to_numpy()) - STEP_SIZE < 1e-10
251 measured_time_delays = (
253 .join(waveforms, left_on=
"A1_AntNum", right_on=
"AntNum")
254 .join(waveforms, left_on=[
"A2_AntNum",
"Pol"], right_on=[
"AntNum",
"Pol"])
256 pl.struct(
"waveforms (volts)",
"waveforms (volts)_right")
260 (wf1 - np.mean(wf1)) / np.std(wf1),
261 (wf2 - np.mean(wf2)) / np.std(wf2),
264 for wf2, wf1
in s.to_numpy()
266 ).alias(
"correlation"),
269 pl.col(
"correlation").arr.max().alias(
"max correlation"),
270 pl.col(
"correlation").arr.arg_max().alias(
"max correlation idx"),
273 pl.col(
"max correlation idx").map_batches(
lambda idx: CORRLAGS[idx] * STEP_SIZE)
274 .alias(
"measured time delays (ns)")
277 "measured time delays (ns)",
"max correlation",
278 r"^A[12]_(?:AntNum|Ring|Rho|Phi|Z)(?: \(placeholder\))?$",
282 return measured_time_delays
285def retrieve_relevant_antennas_from_all_pairs(phase_center_pairs: pl.DataFrame):
286 r"""! Retrieves the (unique) antennas, given a bunch of antenna pairs.
288 @param[in] phase_center_pairs The output of #load_dataset_and_measure_time_delays
289 @retval relevant_antennas
291 * This step is not trivial, as explained below.
292 * It is conceivable that not all antennas receive signals clear enough for calibration purposes
293 (resulting in weak correlations).
294 * As such, the weakly correlated antenna pairs should be filtered out.
297 pulser_directions_and_pairwise_time_delays = (
298 load_dataset_and_measure_time_delays(dataset=ds, phase_center_pairs=nominal_pairs)
299 .filter(pl.col("max correlation") > 0.8)
302 * It is possible that some antennas end up getting filtered out.
303 * Sample output (note that only 76 out of 96 MI antennas survived the filter in this case):
306┌────────┬──────┬───────────────────┬───────────────────┬─────────────────┬──────────┬───────────┬───────┐
307│ AntNum ┆ Ring ┆ Rho (placeholder) ┆ Phi (placeholder) ┆ Z (placeholder) ┆ Rho ┆ Phi ┆ Z │
308│ --- ┆ --- ┆ --- ┆ --- ┆ --- ┆ --- ┆ --- ┆ --- │
309│ enum ┆ u8 ┆ u16 ┆ u16 ┆ u16 ┆ f64 ┆ f64 ┆ f64 │
310╞════════╪══════╪═══════════════════╪═══════════════════╪═════════════════╪══════════╪═══════════╪═══════╡
311│ 101 ┆ 1 ┆ 0 ┆ 96 ┆ 192 ┆ 1.188 ┆ 0.0 ┆ 5.114 │
312│ 201 ┆ 2 ┆ 1 ┆ 97 ┆ 193 ┆ 2.296 ┆ 0.0 ┆ 1.457 │
313│ 301 ┆ 3 ┆ 2 ┆ 98 ┆ 194 ┆ 2.296 ┆ 0.0 ┆ 0.728 │
314│ 401 ┆ 4 ┆ 3 ┆ 99 ┆ 195 ┆ 2.296 ┆ 0.0 ┆ 0.0 │
315│ 102 ┆ 1 ┆ 4 ┆ 100 ┆ 196 ┆ 1.076821 ┆ 0.261538 ┆ 4.476 │
316│ … ┆ … ┆ … ┆ … ┆ … ┆ … ┆ … ┆ … │
317│ 423 ┆ 4 ┆ 91 ┆ 187 ┆ 283 ┆ 2.295825 ┆ -0.523638 ┆ 0.0 │
318│ 124 ┆ 1 ┆ 92 ┆ 188 ┆ 284 ┆ 1.07708 ┆ -0.26224 ┆ 4.476 │
319│ 224 ┆ 2 ┆ 93 ┆ 189 ┆ 285 ┆ 2.295502 ┆ -0.261893 ┆ 1.457 │
320│ 324 ┆ 3 ┆ 94 ┆ 190 ┆ 286 ┆ 2.295502 ┆ -0.261893 ┆ 0.728 │
321│ 424 ┆ 4 ┆ 95 ┆ 191 ┆ 287 ┆ 2.295502 ┆ -0.261893 ┆ 0.0 │
322└────────┴──────┴───────────────────┴───────────────────┴─────────────────┴──────────┴───────────┴───────┘
324 * If we still pass these filtered antennas to the #objective_function,
325 SciPy's minimizer would act as if these antennas are relevant and try to still modify their
326 phase centers during the minization.
330 .select(pl.col(
r"^A1_(?:AntNum|Ring|Rho|Phi|Z)(?: \(placeholder\))?$"))
331 .rename(
lambda name: re.sub(
r"^A1_(.*)$",
r"\1", name))
335 .select(pl.col(
r"^A2_(?:AntNum|Ring|Rho|Phi|Z)(?: \(placeholder\))?$"))
336 .rename(
lambda name: re.sub(
r"^A2_(.*)$",
r"\1", name))
339 relevant_antennas = (
340 a1.vstack(a2).unique().sort(
"AntNum")
342 return relevant_antennas
345def objective_function(phase_center_guess: pl.Series,
346 phase_center_placeholders: pl.Series,
347 pulser_directions_and_measured_time_delays: pl.DataFrame,
349 r"""!Computes the expected time delays and compares them with the measured time delays,
350 designed to be run by SciPy's minimizer.
352 @param[in] phase_center_guess The output of #retrieve_relevant_antennas_from_all_pairs
353 @param[in] phase_center_placeholders The output of #retrieve_relevant_antennas_from_all_pairs
354 @param[in] pulser_directions_and_measured_time_delays The output of #load_dataset_and_measure_time_delays
355 @param[in] axis Axis to fit: \f$\rho\f$, \f$\phi\f$, or \f$z\f$
356 @retval total_difference_bw_expected_time_delay_and_measured_time_delay A scalar
358 * In #load_dataset_and_measure_time_delays(), the `measured_time_delay` has already been computed.
359 * The job of this function is to
360 -# Given `phase_center_guess`, replace the placeholder antenna phase centers in
361 `pulser_directions_and_pairwise_time_delays`
362 -# Compute the pairwise antenna displacement vectors (call these \f$\bf{d}\f$),
363 using the updated antenna positions.
364 -# Compute the `expected time delay` based on the dot product between \f$\bf{d}\f$ and
365 `incoming pulse direction (Phi Theta)`,
366 see [this figure](@ref timedelaybydotproduct) for an illustration.
368 ┌───────────────────────────┬───────────────────────────┐
369 │ measured time delays (ns) ┆ expected time delays (ns) │
372 ╞═══════════════════════════╪═══════════════════════════╡
373 │ -0.866667 ┆ -0.853384 │
374 │ -0.866667 ┆ -0.853384 │
375 │ -7.466667 ┆ -7.487111 │
377 │ -9.466667 ┆ -9.48138 │
379 │ 8.333333 ┆ 8.33698 │
381 │ -0.866667 ┆ -0.855732 │
383 │ 1.466667 ┆ 1.463433 │
384 └───────────────────────────┴───────────────────────────┘
386 -# Quantify the difference between the expectation and the measurement; this is done by
387 summing the difference over all rows above.
388 * SciPy's minimizer tries to minimize the total difference by updating `phase_center_guess`.
390 from scipy.constants
import c
as speed_of_light
392 phi_p = pl.col(
"incoming pulse direction (Phi Theta)").arr.get(0)
393 theta_p = pl.col(
"incoming pulse direction (Phi Theta)").arr.get(1)
394 x_p = phi_p.cos() * theta_p.sin()
395 y_p = phi_p.sin() * theta_p.sin()
398 r_1 = pl.col(
"A1_Rho")
399 r_2 = pl.col(
"A2_Rho")
402 phi_1 = pl.col(
"A1_Phi")
403 phi_2 = pl.col(
"A2_Phi")
405 A1minusA2_dotProduct_signalDir = (
406 x_p * (r_1 * phi_1.cos() - r_2 * phi_2.cos()) +
407 y_p * (r_1 * phi_1.sin() - r_2 * phi_2.sin()) + z_p * (z_1 - z_2)
410 total_difference_bw_expected_time_delay_and_measured_time_delay = (
411 pulser_directions_and_measured_time_delays
413 pl.col(f
"A1_{axis} (placeholder)").replace_strict(phase_center_placeholders, phase_center_guess).alias(f
"A1_{axis}"),
414 pl.col(f
"A2_{axis} (placeholder)").replace_strict(phase_center_placeholders, phase_center_guess).alias(f
"A2_{axis}")
417 (A1minusA2_dotProduct_signalDir / speed_of_light * 1e9).alias(
"expected time delays (ns)")
420 (pl.col(
"measured time delays (ns)") - pl.col(
"expected time delays (ns)"))
421 .abs().sum().alias(
"time delay difference")
424 return total_difference_bw_expected_time_delay_and_measured_time_delay.item()
427def _plot_calibration_result(axis: str, before: pl.DataFrame, after: np.ndarray):
429 @param[in] axis Axis to fit: \f$\rho\f$, \f$\phi\f$, or \f$z\f$
430 @param[in] before The output of of #retrieve_relevant_antennas_from_all_pairs
431 @param[in] after The `restul.x` of running `scipy.optimize.minimize` on #objective_function
435 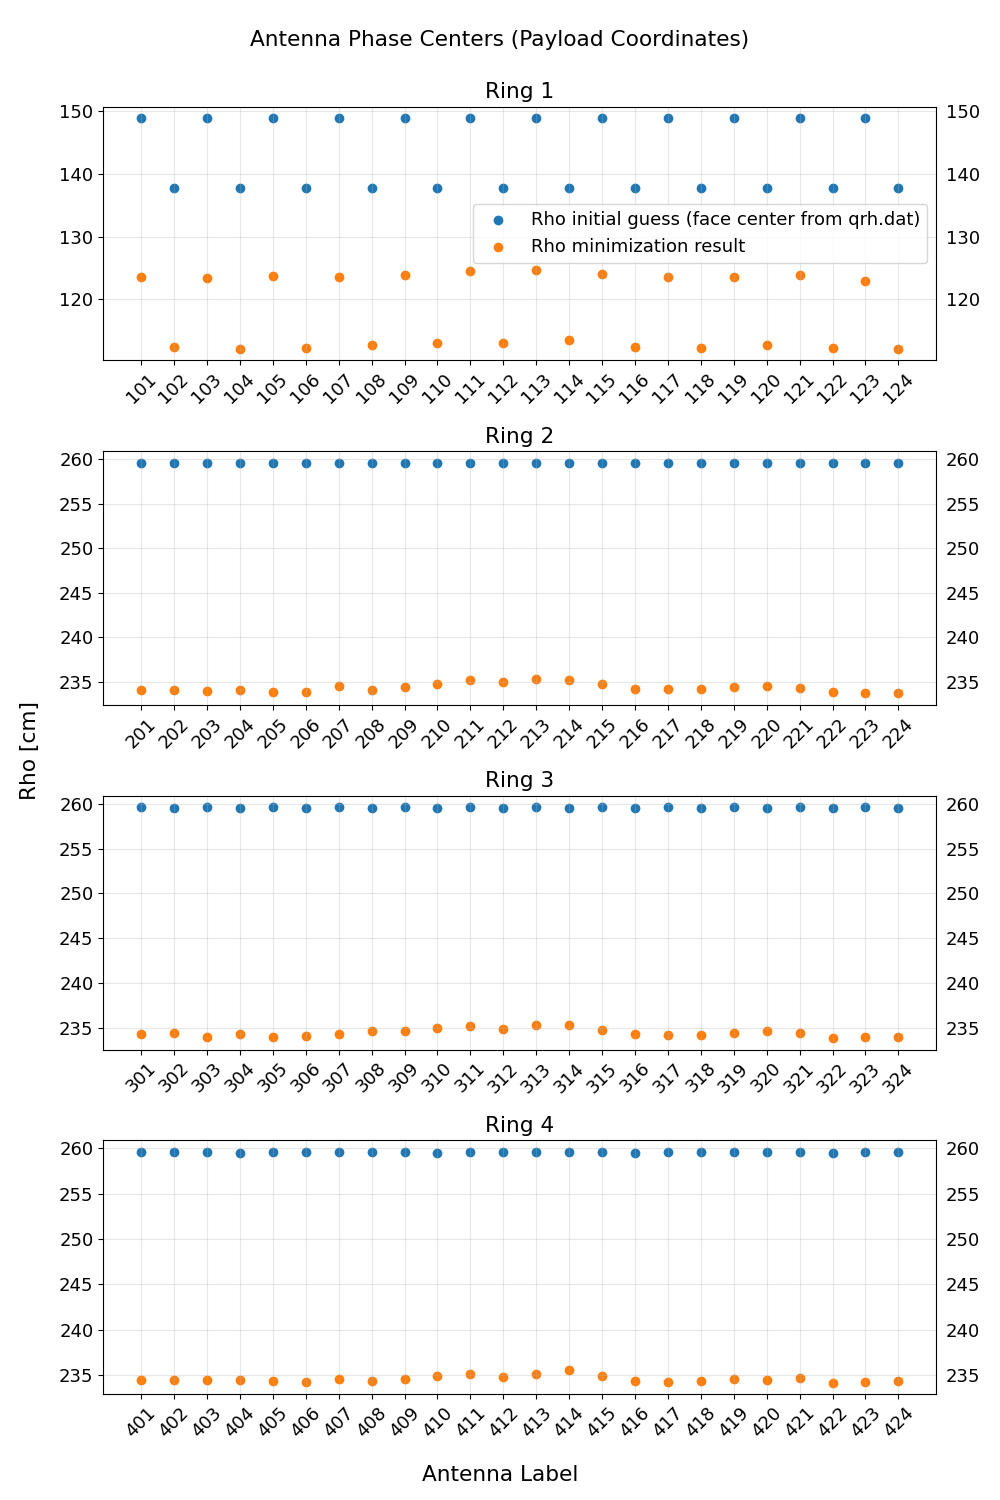
437 import matplotlib.pyplot
as plt
438 plt.rcParams.update({
'font.size': 13})
439 fig1, ax1 = plt.subplots(nrows=4, figsize=(10, 15), tight_layout=
True)
443 pl.Series(after).alias(f
"{axis} minimization result")
447 for i
in range(before[
'Ring'].unique().len()):
448 ring = before_and_after.filter(pl.col(
"Ring") == (i + 1))
450 ax1[i].scatter(ring[
'AntNum'], ring[f
"{axis}"] * 1e2,
451 label=f
"{axis} initial guess (face center from qrh.dat)")
452 ax1[i].scatter(ring[
'AntNum'], ring[f
"{axis} minimization result"] * 1e2,
453 label=f
"{axis} minimization result")
454 ax1[i].set_title(f
"Ring {i + 1}")
455 ax1[i].tick_params(axis=
'x', labelrotation=45, labelright=
True)
456 ax1[i].tick_params(axis=
'y', labelright=
True)
457 ax1[i].grid(alpha=.3)
460 fig1.supylabel(f
"{axis} [cm]")
461 fig1.supxlabel(
'Antenna Label')
462 fig1.suptitle(
'Antenna Phase Centers (Payload Coordinates)\n')
463 fig1.savefig(
"phase_center_fit_result.png")
466if __name__ ==
"__main__":
468 from scipy.optimize
import minimize
471 j25: Path = os.environ.get(
"PUEO_UTIL_INSTALL_DIR") / Path(
"share/pueo/geometry/jun25/qrh.dat")
472 nominal_pairs = generate_antenna_phase_center_pairs_with_placeholders(qrh_dot_dat=j25)
475 ds: ROOT.pueo.Dataset = load_pueoEvent_Dataset(pueo_mc_data=Path(
"/tmp"), run_number=2)
476 pulser_directions_and_pairwise_time_delays = (
477 load_dataset_and_measure_time_delays(dataset=ds, phase_center_pairs=nominal_pairs)
478 .filter(pl.col(
"max correlation") > 0.8)
481 relevant_antennas = (
482 retrieve_relevant_antennas_from_all_pairs(
483 phase_center_pairs=pulser_directions_and_pairwise_time_delays
488 result = minimize(fun=objective_function,
489 x0=relevant_antennas[AXIS],
490 args=(relevant_antennas[f
"{AXIS} (placeholder)"],
491 pulser_directions_and_pairwise_time_delays, AXIS),
492 method=
'Nelder-Mead',
493 options={
'maxiter': 500_000})
496 _plot_calibration_result(axis=AXIS, before=relevant_antennas, after=result.x)
 1.17.0